
Analytics
Know your numbers. Grow your space.
Revenue, occupancy, member retention and booking data — all in one place so you spend less time in spreadsheets and more time building the business. CoWorkly's reports update in real time so the picture you see is always accurate.
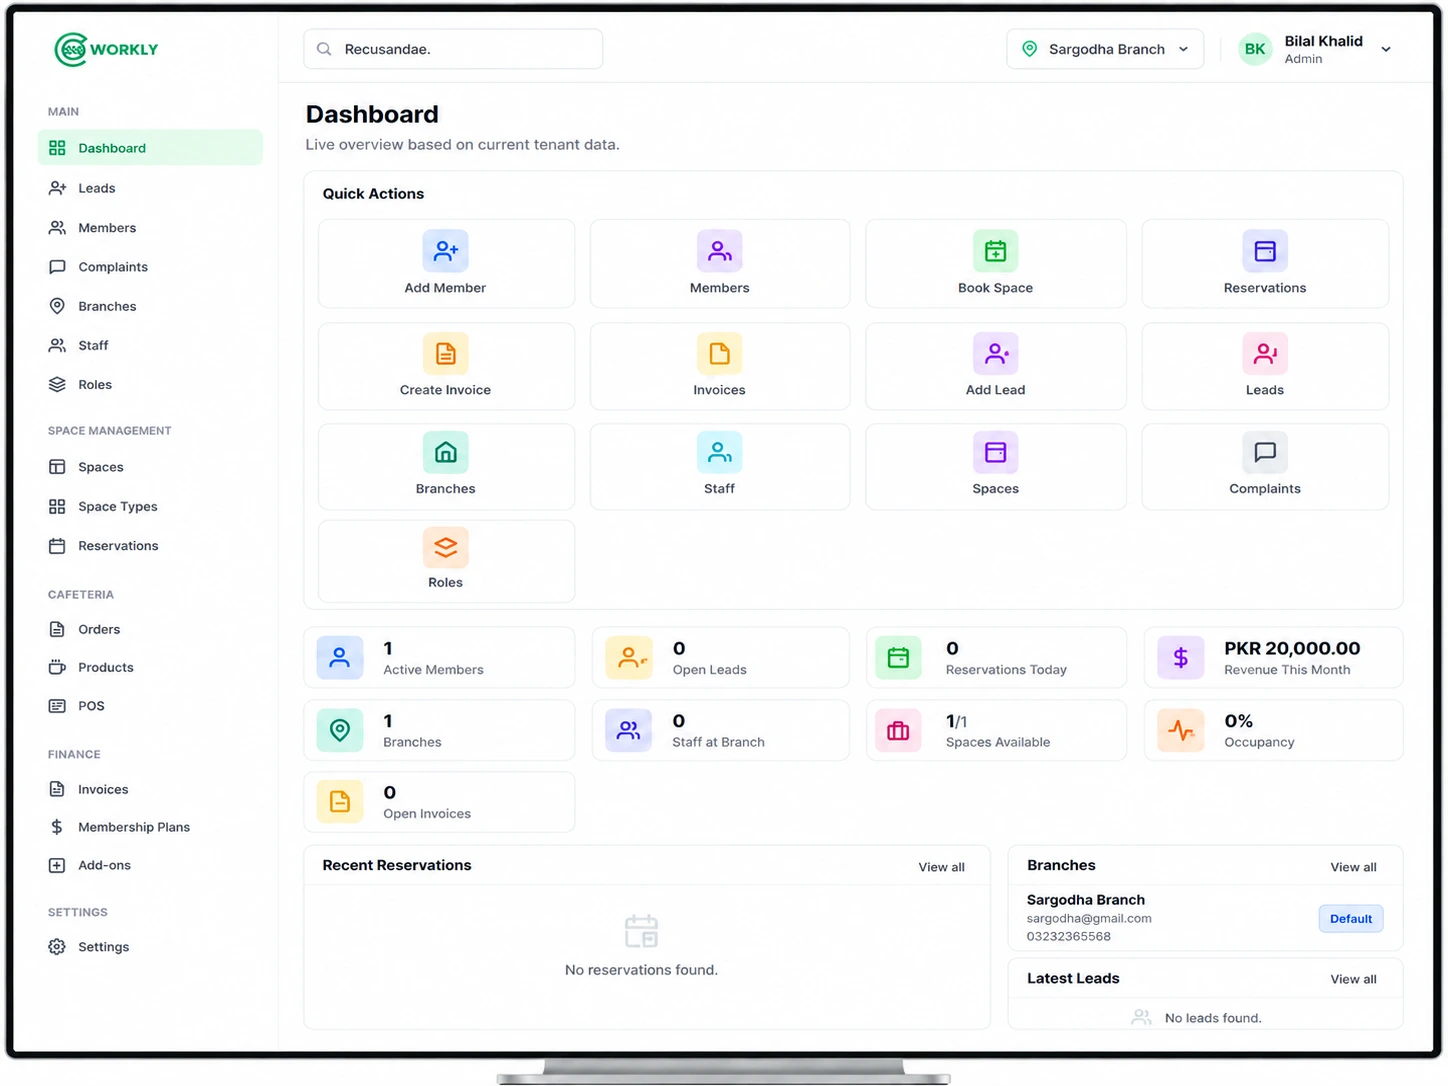
See CoWorkly analytics in action.
A walkthrough of the reporting dashboard — revenue trends, occupancy rates, member activity and more.

The metrics that matter most to coworking operators.
-
Revenue
Monthly recurring revenue, one-off charges and total collected by period. See how revenue trends over time and compare periods.
-
Occupancy
How full your space is on any given day, week or month — broken down by desk, office and meeting room. Know your peak days and your quiet ones.
-
Member growth
New members added, members who left and net member count over time. See your churn rate and identify when members tend to leave.
-
Invoice & payment summary
Total invoiced, total collected, total outstanding and total overdue — with drill-down into individual invoices.
-
Booking data
Which rooms and desks get booked most. Peak booking times. Usage per member and per plan.
-
Lead conversion
How many leads entered the pipeline, how many converted to members and what was the average conversion time.
Questions about CoWorkly analytics.
Are the reports updated in real time?
Yes. Data in CoWorkly's analytics dashboard reflects the current state of your space — every payment, booking and membership change updates the numbers immediately.
Can I export reports?
Yes. Most reports can be exported to CSV so you can import them into your accountancy software or share them with stakeholders.
Can I see reports per branch?
Yes. In a multi-branch setup, you can view analytics for the whole organisation or filter down to a single location.
Can I compare periods?
Yes. Revenue, occupancy and membership reports can be compared month-over-month or year-over-year so you can spot trends and seasonal patterns.
Make every decision with data behind it.
See CoWorkly's analytics dashboard in a live demo with your space in mind.